

In statistics, you need to know the mean median mode and range when analyzing data. We often see these measures, often called central tendency and dispersion measures. It summarizes a large data set by finding little points and variations in the data set. In this article, I will explain these key concepts, how you calculate them, and how these are important in everyday life and professionally.
What is Mean Median Mode?
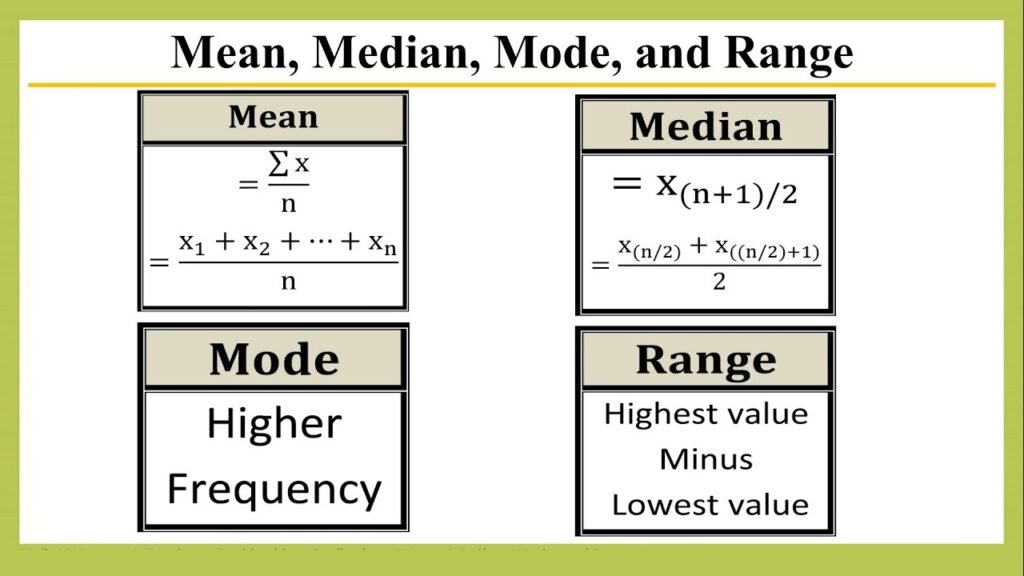
One of the most used measures in statistics is the mean. ‘It is just a common mean of a collection of numbers.’ To find the mean, divide the sum of all values in the dataset by the number of values. The mean tells us where the center of a range of data is. But, it can be skewed by anything too high or too low, called an outlier. However, this does not necessarily undermine the use of the means to spot trends in data.
Understanding Median
The median of a data set is a value placed between the arrangement of all the numbers in ascending or descending order. The median is the value in the center of the values when there is an odd number of values. The median is the average of the two middle numbers for datasets with an even number of values. When outlier values are present, the mean isn’t very useful because extreme values can skew it. Thus, the median may be preferable to the mean in this situation, as it better represents the central data value without being affected by the extreme values.
Exploring Mode
The mode of a dataset is the value that appears most frequently. The mode is not a calculation, like the mean and median, but simply that value that most often occurs. It means a dataset has more than one mode if more than one value has the same frequency. Sometimes, there’ll be no mode if there’s no repetition within the numbers. This is particularly important if you analyze categorical data or frequency.
Defining Range
Dispersion is a range in a dataset measured by the difference between the largest and smallest values. The range is the largest number minus the smallest number. It helps in understanding how spread apart the values of a dataset are. The range is a simple way of thinking about the spread of data, but it is also affected by outliers, so it isn’t as accurate when working with data with extreme values.
Mean In Data Analysis And Its Importance
If you want to get an instant snapshot of trends in data, the mean is an excellent measure. In finance, economics, and education, averages are obtained and compared to benchmarks. Often, the mean is used to decide where data drives it. For instance, policymakers can learn from a given population’s average income on their conditions. While the mean may not always be the best measure when working with data containing outliers, the median is sometimes the best.
When to Use the Median?
The median is useful for finding information from data skewed by outliers. The median is a more reliable measure of central tendency in these cases because it is not pulled in the direction of highly high or very low values the way the mean might. One such industry is real estate, where the median price of homes is often used to represent the market because it distills a clearer picture of typical values, not the highest and not the lowest. As a result, the median is more appropriate than the mean, particularly in data with large variability.
Real-Life Applications of Mode
Preferably, data related to preferences, trends, and patterns are analyzed by data, which plays a very important role. It is particularly useful in fields where you must understand which product or service is most popular. For instance, a clothing retailer may purchase more of a particular product size if it is found that the size is sold most often. In the same way, in education, the mode can be used to discover the most typical score in an exam to enlighten teachers on how well the students grasp the material.
Range as a Measure of Spread
The range isn’t as detailed an analysis as other measures of dispersion, but it’s a quick way to see how values are spread in a dataset. For example, in weather forecasting, people will have prepared for variations in daily temperatures by knowing what temperature ranges there will be in a week’s finance; the range can be calculated by calculating how inflated a stock price is over some time and how much a stock price fluctuates. The range is useful because outliers can distort it, but otherwise, it offers insight into the dispersion of the data.
Mean, Median, Mode, and Range
All these statistical measures discern various aspects of a dataset. The average is the mean, and the median is the middle value. This mode lets you pick out the most frequently occurring value, while the range tells you about the range defined by the values. Sometimes, you will need to use multiple of these measures to fully understand the data. For instance, if we’re looking at test scores, using the mean and median will give us an idea of the overall performance, while the mode will give us the most common score and the range of the variability of the scores.
Common Misconceptions
The common misconception is that the mean will always represent good data. The mean can be misleading in databases with outliers or skewed distributions. We also often think that a dataset will always have a mode, which is not always true. You would want to know when other measures, such as the median or mode, might provide better information about the data. Correctly using these measures to understand when and how to use them appropriately is important in good data analysis.
Conclusion
You must know the mean, median, mode, and range to analyze your data correctly. Each measure gives you a different outlook on your data — the average, modes, and spreads. Knowing how to use these statistical tools will help you analyze financial figures, test scores, sales trends, etc., and make informed decisions. For example, the mean can be common, but there are other ways to think about the data, such as the median and the mode, especially if we have outliers from different points of view or have some trend. The range is simple but provides a quick sense of data variability. When combined, these measures provide an overall view of any data.
Looking Smart Visitor Management


2 Comments
Pingback: What Is Debited and Credited In a Trial Balance? - Yashi Digital Education
Pingback: Personal Ledger Account In Government - Yashi Digital Education